The communication model is the theory that explains the communication process with multiple elements. The communication model differs in linear and transactional theory.
The components of the technology acceptance model refer to the dependent, independent, moderator, and mediator variables of TAM theories. Understanding the components of the technology acceptance model is crucial for students, researchers, and HR professionals. It helps professionals understand why people adopt and use the new systems. The researchers adopt the technology acceptance model questionnaire to conduct new research in different fields. The components of the technology acceptance model help top management understand user behavior towards new systems, AI, Gemini AI, and ChatGPT in organizations. They predict acceptance rates and set the implementation strategy, addressing perceived usefulness and ease of use elements of the TAM model.
This article explains the components of the technology acceptance model (TAM) from 1986 to 2008. Based on the literature review, many articles describe the elements of the technology acceptance model (TAM) published in 1989; however, this article presents the components of the TAM model as published in 1986, 1989, 1993, 1996, 2000, and 2008.
components of the TAM model as published in 1986, 1989, 1993, 1996, 2000, and 2008.
Components of TAM Model-1, 2, & 3 at a Glance
TAM Model
Authors
Establish Year
Variables
Technology Acceptance Model (TAM)
Fred D. Davis
1986
Perceived Usefulness, Perceived Ease of Use, and Attitude toward using the system. (Feature: X1, X2, and X3)
Perceived Usefulness, Perceived Ease of Use, Attitude Toward Using, Actual Usage Behavior. (System Design Features)
Technology Acceptance Model (TAM-1)
Venkatesh and Davis
1996
Perceived Usefulness, Perceived Ease of Use, User Behavioral Intention (External Variables).
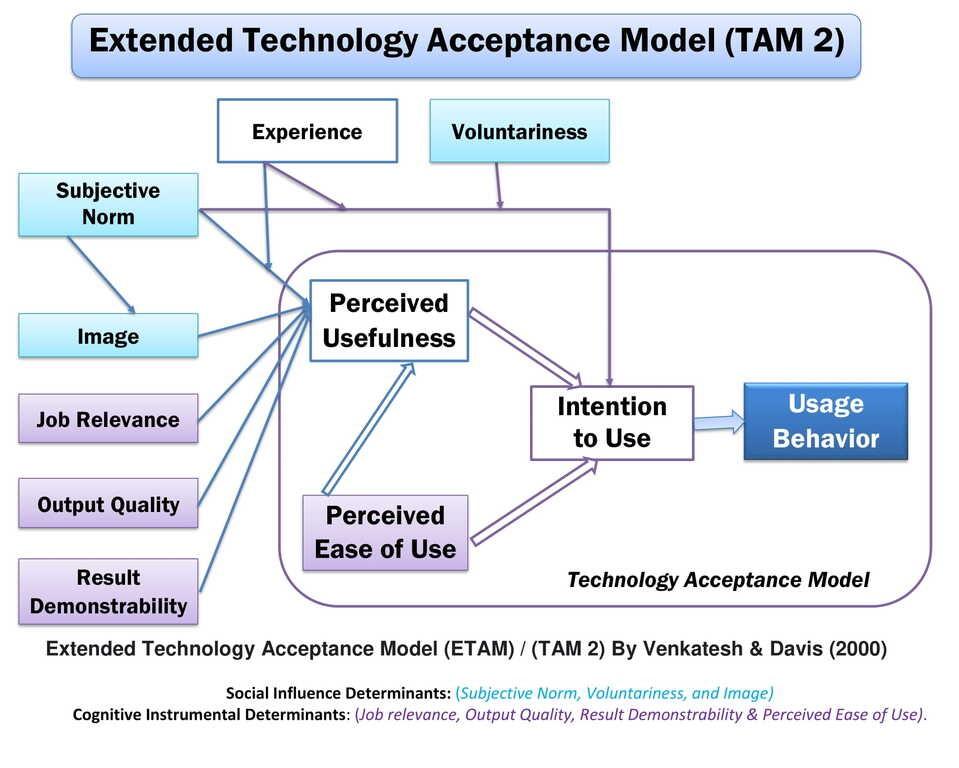
Extended Technology Acceptance Model (TAM 2) or ETAM
Venkatesh and Davis
2000
Perceived Usefulness, Perceived Ease of Use, Intention to Use, Use Behavior, and (Subjective Norm, Voluntariness, Image, Job Relevance, Output Quality, Result Demonstrability, Experience, and Voluntariness)
The Technology Acceptance Model (TAM-3)
Venkatesh & Bala
2008
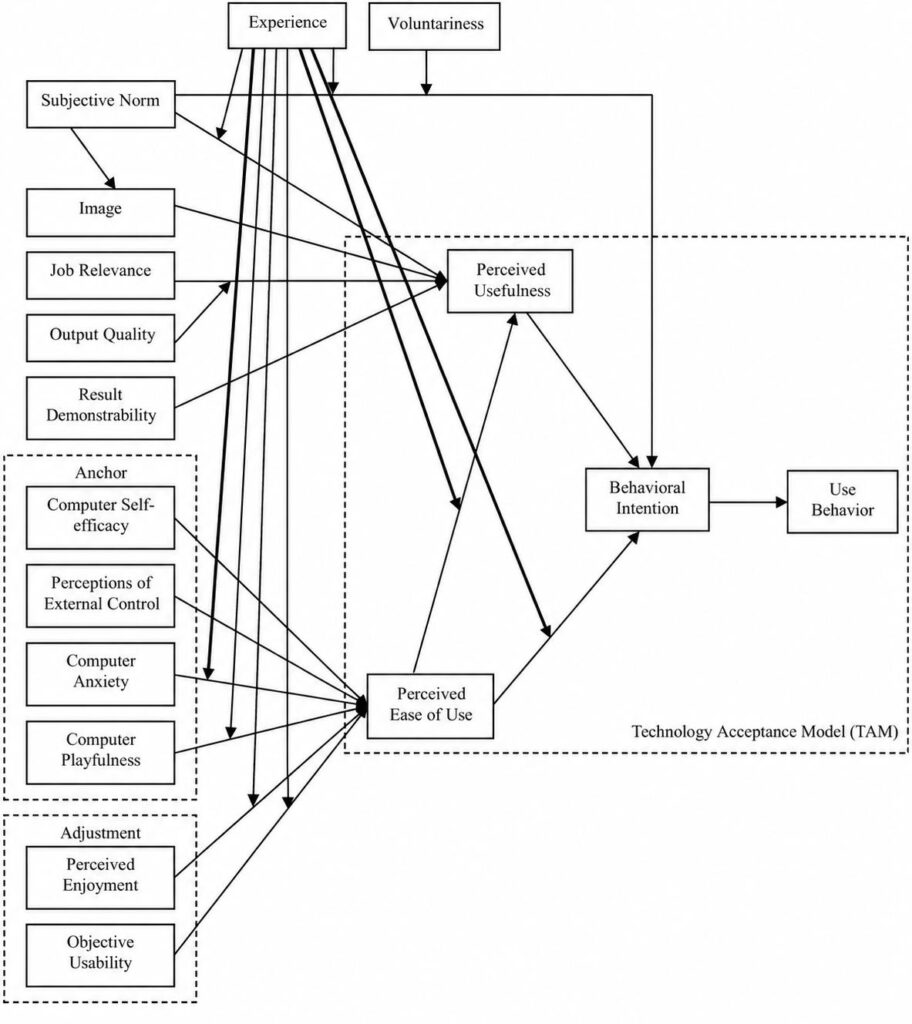
Perceived Usefulness, Perceived Ease of Use, Behavioral Intention, Use behavior, and (Subjective Norm, Voluntariness, Image, Job relevance, Output Quality, Result Demonstrability, Experience, Voluntariness, Computer Self-Efficacy, Perception of External Control, Computer Anxiety, Computer Playfulness, Perceived Enjoyment, Objective Usability)
These components of the technology acceptance model have evolved in diverse fields of study over the years.
Components of the Technology Acceptance Model (TAM-1986)
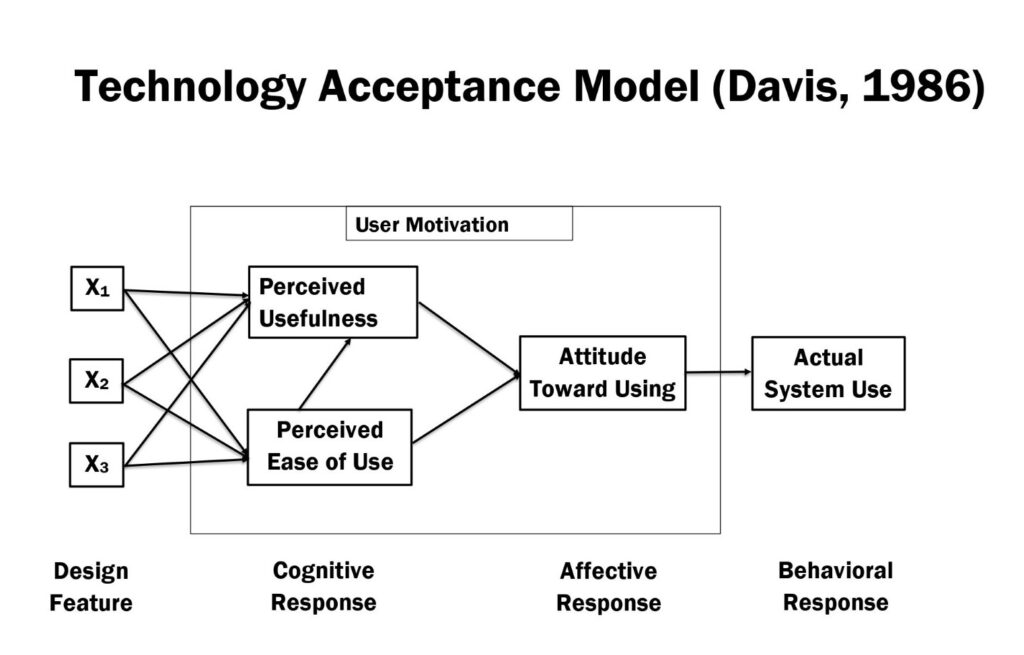
Initially, in 1986, Fred D. Davis included three elements: perceived usefulness, perceived ease of use, and attitude toward use. According to the technology acceptance model (Davis, 1986), the components of the technology acceptance model are:
Perceived Usefulness
Perceived Ease of Use
Attitude toward using the system
However, Fred D. Davis introduces external variables Design Feature: X1, X2, and X3in the technology acceptance model.
Perceived Usefulness
Perceived Usefulness refers to the extent to which a person believes that using a particular system will enhance their job performance (Davis, 1986). It is a measurement factor that assesses how it influences users’ decisions to accept or reject the new system in the workplace. It is an outcome of the anticipated effect on productivity using the new system. For example, using ChatGPT enhances creating images to promote products on social media platforms. It is the most significant element of the technology acceptance model, as it measures people’s beliefs.
Perceived Ease of Use
Perceived ease of use is the degree to which a person believes that utilizing a certain system would be free of mental and physical pressure (Davis, 1986). It is the most significant construct to demonstrate a person’s belief in using the new system. PEOU identifies the user’s perception that the new system will require no or less effort. The user adopts and utilizes the new system when the PEOU is higher. For example, Gemini AI reduces employee workloads, enhancing content creation for product marketing. Perceived ease of use is another crucial component of the technology acceptance model.
Attitude Toward Use
Attitude toward using is a crucial explicit mediator variable in the TAM model that directly affects actual system use. ATU is a person’s emotional response to whether they accept the new system. According to the TAM model, perceived usefulness and perceived ease of use affect attitude toward use and actual use behavior (Davis, 1986).
Design Feature (External Variable)
Design features are external variables in the TAM model that positively affect two core cognitive beliefs: perceived usefulness and ease of use; however, they do not impact attitude or behavioral intention. They are external stimuli such as attributes, interface components, and technical capabilities of the new system. The researchers indicate these features, such as X₁, X₂, and X₃.
TAM Model (Davis, 1986)
Fred D. Davis is the pioneer of the technology acceptance model. He is a professor at the University of Michigan School of Business Administration. His research interests include user acceptance of technology, technology support for decision-making, and motivational factors in computer acceptance.
Research Title:A technology acceptance model for empirically testing new end-user information systems: Theory and results
Author and Published Year: Fred D. Davis (Fred Donald Davis)- 1986
Publisher: Massachusetts Institute of Technology (MIT), Sloan School of Management
Components of the Technology Acceptance Model (Davis, 1989)
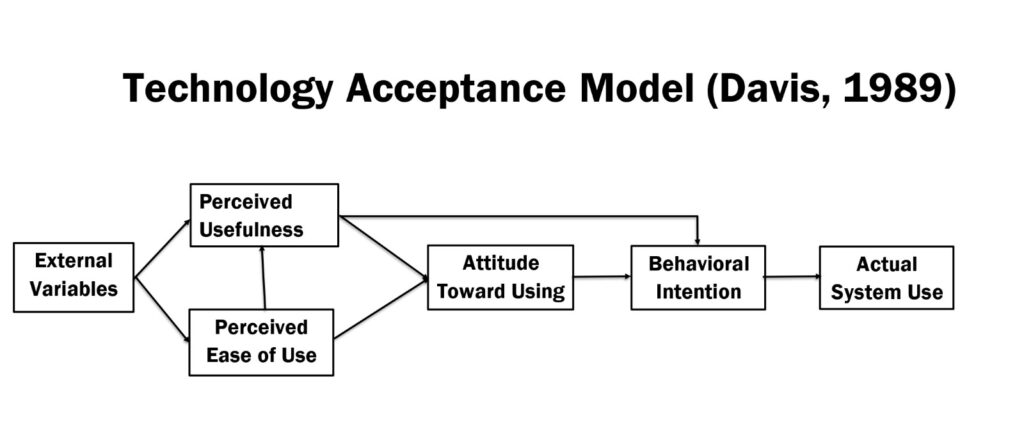
The components of the Technology acceptance model (Davis, 1989) are: external variables, perceived usefulness, perceived ease of use, attitude towards use, behavioral intention, and actual system use.
The six core elements of the TAM model ( Davis, 1989) are:
1. External Variables (EV) (Belief): Factors that influence the adoption of a new system, such as implementation strategy, context, and training methods.
2. Perceived Usefulness (PU): The measurement of a person’s belief in using the new system to enhance productivity in the workplace. It is commonly believed that adopting new technology helps to improve performance.
3. Perceived Ease of Use (PEOU): It is the degree to which a person assumes that the new system helps to complete tasks smoothly without hassle.
4. Attitude Toward Use (ATU): It is an overall affective response of users that the new system is good for us. It is a core variable to determine the user’s emotional reaction to whether to accept or reject the new system. It affects people’s contemporary psychology and actions.
5. Behavioral Intention (BI): It is a crucial component of the technology acceptance model that indicates the user has decided to use the new system in the workplace. It prompts users to implement the new system in both personal and professional contexts.
6. Actual System Use (ASU): It is a dependable variable in the technology acceptance model that refers to the degree to which users accept the new system and apply it in real-life activities. It measures how the new system works when people use it to complete regular tasks.
Difference Between the TAM 1986 and TAM 1989
According to the technology acceptance model (Davis, 1989), Perceived Usefulness (PU) directly influences the user’s Behavioral Intention to accept and use the new system. PU bypasses the Attitude Toward Use entirely and positively affects BI.
TAM Model (Davis, 1989)
Research Title:Perceived Usefulness, Perceived Ease of Use, and User Acceptance of Information Technology
Author and Published Year: Fred D. Davis- 1989
Publisher: Management Information Systems Research Center (MISRC), University of Minnesota (via the journal MIS Quarterly)
Components of the Technology Acceptance Model (TAM) (Davis et al., 1989)
The components of the technology acceptance model (Davis et al., 1989) are:
External Variables (EV)(Belief)
Perceived Usefulness (PU)
Perceived Ease of Use (PEOU)
Attitude Toward Use (ATU)
Behavioral Intention (BI)
Actual System Use (ASU)
According to the technology acceptance model (Davis et al., 1989), its components explain why users accept new computer technology. It also helps explain user behavior towards the adoption of new computer technology.
The Technology Acceptance Model (TAM) explains users’ intention to adopt technology through three variables: perceived usefulness, perceived ease of use, and attitude toward use.
Technology Acceptance Model (TAM) (Davis et al., 1989)
In 1989, Fred D. Davis, Richard P. Bagozzi, and Paul R. Warshaw presented the technology acceptance model in the research paper “User Acceptance of Computer Technology: A Comparison of Two Theoretical Models,” published by the Institute for Operations Research and the Management Sciences (INFORMS) located in Maryland, USA. The TAM model was derived from the Theory of Reasoned Action (TRA), which describes the factors that stimulate people to change their behavior.
Research Title: User Acceptance of Computer Technology: A Comparison of Two Theoretical Models.
Author & Published Year: Fred D. Davis, Richard P. Bagozzi, and Paul R. Warshaw in 1989.
Publisher: INFORMS
Components of the Technology Acceptance Model (TAM) (Davis, 1993)
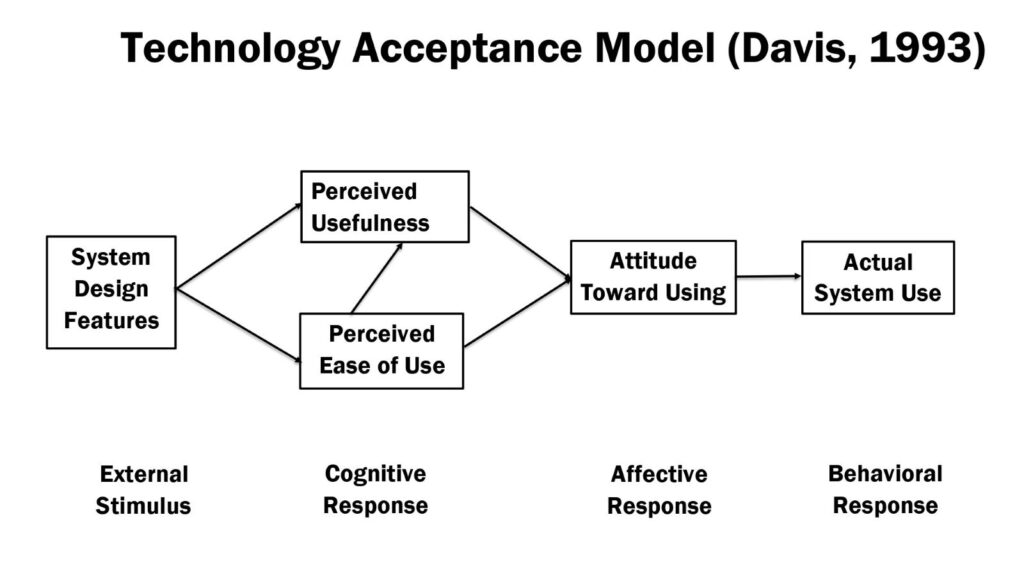
The five components of the technology acceptance model (Davis, 1993) are:
System Design Features:
Perceived Usefulness
Perceived Ease of Use
Attitude Toward Using
Actual Usage Behavior
TAM Model (Davis, 1993)
Research Title: User Acceptance of Information Technology: System Characteristics, User Perceptions, and Behavioral Impacts.
Author & Published Year: Fres D Davis- 1993
Publisher: University of Michigan, Business School, Ann Arbor, M1 48109, USA.
Components of the Technology Acceptance Model (TAM-1): Venkatesh and Davis, 1996
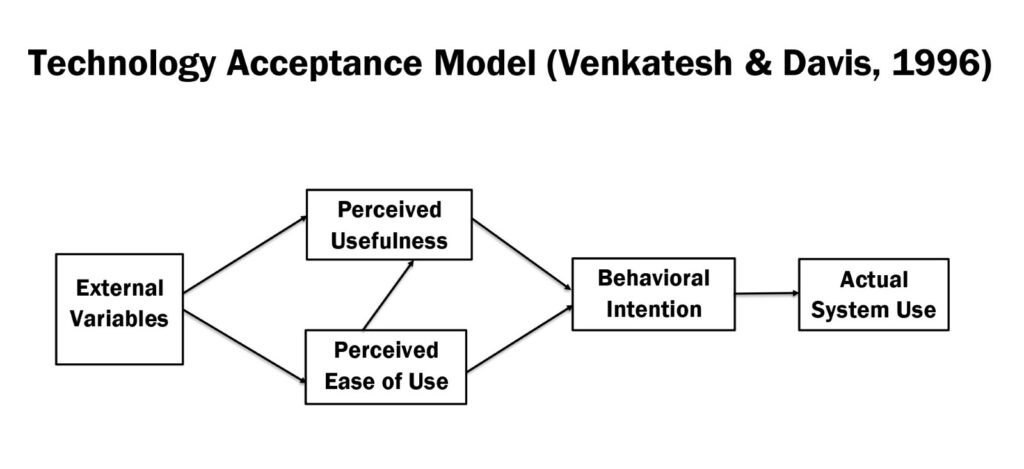
Variables: Perceived Usefulness, Ease of Use, User’s Behavioral Intention, and (External Variables)
External variables: Computer self-efficacy and Objective Usability
However, in 1996, Viswanath Venkatesh and Fred D. Davis included the variable “Attitude toward Using” in the previous model and outlined the final version of the Technology Acceptance Model.
TAM Model (Venkatesh and Davis, 1996)
Research Title:A Model of the Antecedents of Perceived Ease of Use: Development and Test
Authors and Published Year: Viswanath Venkatesh and Fred D. Davis- 1996
Publisher: Wiley (on behalf of the Decision Sciences Institute via the journal Decision Sciences)
Technology Acceptance Model (TAM-2) Components
The components of the technology acceptance model (Venkatesh and Davis, 2000) are:
Perceived Usefulness
Perceived Ease of Use
Intention to Use
Use Behavior
(Subjective Norm, Voluntariness, Image, Job relevance, Output Quality, Result Demonstrability, Experience, and Voluntariness)
TAM 2 Model Elements
Subjective Norm (SN): It is a crucial component of the technology acceptance model that directly affects perceived usefulness and indirectly affects it through another construct, Image. SN is the social influence of people close to them. This variable determines how your close people influence you, depending on their acceptance and use of the new system and technology.
Image (IMG): Image is a social pressure construct that influences people to adopt a new system to improve their status within an organization or society.
Job Relevance (JR): It is another key construct of PU that influences people to use the new system to complete a specific job in the organization. It is the degree to which people believe the technology is an ideal tool for completing their jobs.
Output Quality (OQ): It is a cognitive instrumental process that determines how well the new technology accomplishes the specific tasks required for the job.
Result Demonstrability (RD): It is a core cognitive instrument that identifies the tangible significance of the new system in performance.
Experience: It represents how experience affects the ability to accept and navigate new technology. Users rely on subjective norms when they have little experience, and, as their experience grows, they evaluate the new system based on skills rather than peer pressure.
Voluntariness of Use: It indicates whether use of the new system in the workplace is compulsory or discretionary. Social influence has a stronger positive impact on acceptance of the new system when it is mandatory.
TAM 2 Model Published Paper Details
TAM originated with Venkatesh and Davis in 2000, building on earlier work. Instead of just one idea, it added more reasons people find tech useful – like peer pressure or practical benefits. This version shows how factors such as coworkers’ perceptions, job fit, quality of results, and clear outcomes shape whether someone uses a system.
Research Title:A Theoretical Extension of the Technology Acceptance Model: Four Longitudinal Field Studies
Authors and Published Year: Viswanath Venkatesh and Fred D. Davis- 2000
Publisher: Institute for Operations Research and the Management Sciences (INFORMS), via the journal Management Science
Components of the Technology Acceptance Model (TAM-3)
The components of the technology acceptance model (Venkatesh and Bala, 2008) are:
Computer Self‑Efficacy (CSE): CSE is the primary anchor construct of perceived ease of use (PEOU), representing the user’s ability and confidence in using the new system. It shows how confident people feel in using the new technology to complete a specific task in the workplace.
Perception of External Control (PEC): It is another crucial determinant of PEOU, representing the user’s belief that the organization will provide support, such as technical support and training to use the new system.
Computer Anxiety (CA): CA is an adverse feeling that hinders a user’s acceptance and use of a new system in the workplace. CA is an emotional barrier to adopting new technology.
Computer Playfulness (CP): It is an anchoring factor that enhances people’s primary willingness to accept and interact with the new system.
Perceived Enjoyment (PE): It is an adjustment construct in the technology acceptance model (TAM-3) that influences behavioral intention through perceived ease of use. Perceived enjoyment reflects users’ fun and experience when adopting and interacting with the new system in the workplace.
Objective Usability (OU): It is another adjustment construct that directly affects perceived ease of use to influence behavioral intention to use the new system. Objective Usability refers to data on how easily people can navigate the system to obtain precise results.
The author explains other variables (Subjective Norm, Voluntariness, Image, Job relevance, Output Quality, Result Demonstrability, Experience, and Voluntariness) in the component of the technology acceptance model TAM-2 section in this article.
TAM 3 Model Publishing Paper Details
The Technology Acceptance Model (TAM3) was introduced by Venkatesh and Bala in 2008. TAM-3 provides valuable rational explanations of how and why individuals decide to adopt and use ITs, particularly the work on the determinants of perceived usefulness and perceived ease of use.
Research Title:Technology Acceptance Model 3 and a Research Agenda on Interventions
Authors and Published Year: Viswanath Venkatesh and Hillol Bala in 2008
Publisher:Decision Sciences Journal.
Edited by: Nagesh Murthy, University of Oregon; Liangfei Qiu, University of Florida
Conclusion: Components of TAM models
In conclusion, the key elements of the technology acceptance models are perceived usefulness and perceived ease of use, which influence attitudes towards using the new system. Understanding the core components of the technology acceptance model conveys significant insight into how organizations and policymakers adopt new systems. TAM is the most cited and accepted theory for understanding technological innovation and its application in organizations. Therefore, technology acceptance models make both theoretical and practical contributions across personal, social, and professional contexts.
FAQ (Frequently Asked Questions): Components of the Technology Acceptance Model
Q: What are the core components of the technology acceptance model?
A: The three key components of the technology acceptance model are Perceived Usefulness, Perceived Ease of Use, and Attitude toward using the new system.
Q: Who is the pioneer of the technology acceptance model (TAM)?
A: Fred D. Davis is the pioneer author of the TAM model.
Q: What is the original and final technology acceptance model?
Fred D. Davis introduced the final technology acceptance model in 1989, comprising six elements: external variables, perceived usefulness, perceived ease of use, attitude towards use, behavioral intention, and actual system use.
What is the most cited model in the field of information and communication technology?
TAM has been designated as the most-cited model in the field of information and communication technology (ICT).
What is the most significant theory to adopt for Artificial Intelligence AI adoption?
The technology acceptance model (TAM) is one of the most significant models of AI adoption.
References APA 7th Edition: Scholarly Sources
Davis, F. D. (1986). A technology acceptance model for empirically testing new end-user information systems: Theory and results (Doctoral dissertation, Massachusetts Institute of Technology, Sloan School of Management). Massachusetts Institute of Technology.
Davis, F. D. (1989). Perceived usefulness, perceived ease of use, and user acceptance of information technology. MIS Quarterly, 13(3), 319–340. https://doi.org/10.2307/249008
Davis, F. D. (1993). User acceptance of information technology: System characteristics, user perceptions, and behavioral impacts. International Journal of Man-Machine Studies, 38(3), 475–487. https://doi.org/10.1006/imms.1993.1022
Davis, F. D., & Venkatesh, V. (1996). A critical assessment of potential measurement biases in the Technology Acceptance Model: Three experiments. International Journal of Human-Computer Studies, 45(1), 19–45. https://doi.org/10.1006/ijhc.1996.0040
Venkatesh, V., & Bala, H. (2008). Technology acceptance model 3 and a research agenda on interventions. Decision Sciences, 39(2), 273-315.
M M Kobiruzzaman is a researcher, academic content writer, traveler, and the founding editor of Newsmoor.com. Specializing in communication, management, technology adoption models, and frameworks analysis, and journalism, his work bridges the gap between theory explanation and cultural communication. With a strong background in communication and management, he is dedicated to providing authoritative guides that elevate business and media literacy and academic writing standards.
Quantitative Research Paper Example For Communication Students. Example of a Quantitative Research Paper for Students. Quantitative research and communication examples. Quantitative research paper about communication. How to write a quantitative research paper.
Quantitative Research
Quantitative Research Components
Quantitative research employs a systematic approach to gathering and analyzing numerical data to explain, project, or manage circumstances. It relies on objective evaluations and statistical techniques to test hypotheses, identify trends and connections, and extend conclusions to broader populations. The purpose of quantitative research is to assess the relationship between variables.
The elements of Quantitative Research Papers for Communication Students are:
Research Topic
Abstract
Introductions
Literature Review
Hypothesis Development
Conceptual Model
Methodology
Results and Discussions
Conclusion
References
Quantitative Research Paper Example For Communication Students
Research Topic: An Examination of the Relationship between Social Media Engagement and Citizen Journalism Practice
Social media has been an indispensable communication channel for sharing and consuming news. The evolution of social media platforms has boosted digital journalism practice globally. This study intends to examine factors influencing social media engagement in citizen journalism by adopting a prominent technology adoption model, the unified theory of acceptance and use of technology (UTAUT).
The researchers designed online survey questionnaires and distributed them via Google Forms to university students, collecting 301 valid responses. The structural equation modeling (SEM-PLS) approach was used to test the presented model using empirical data from respondents. The findings show that performance expectancy, effort expectancy, and social influence significantly affect social media users’ practice of citizen journalism. The results clearly indicate that social media engagement significantly influenced citizen journalism practice. People practice citizen journalism on social media sites to report real-time news, entertain friends, educate people, and shape public opinion.
Keywords: Social Media, Engagement, Citizen Journalism, UTAUT, Online news.
Introduction
Social media platforms change people’s news-sharing and consuming behaviors. A study found that around 45 percent of Americans get their news from Facebook (Chen 2020). Social media enables people to share and consume news easily and instantly. Citizen journalists accumulate and disseminate news on social media sites, including Facebook, WeChat, WhatsApp, and Instagram, to inform netizens. People practice citizen journalism to share opinions, repurpose mainstream media content, shape public opinion, report on crime, and entertain each other. Sometimes, citizen journalists create creative news stories that combine text, pictures, and videos to raise social awareness.
In Malaysia, digital journalism has become a powerful means of shaping public opinion by sharing informative news on social media during the COVID-19 pandemic (Raza et al. 2021: 144). The Malaysian government controls mass media outlets and their practitioners, directly and indirectly, during the broadcast of news and information (Jalli 2017). The desire to share news on social media is growing daily. It is reckoned that more than 80 percent of youth in Malaysia use social media (Ismail et al. 2019: 508). However, citizen journalism is a double-edged sword with both positive and negative consequences for society (Barry 2017). Because of the availability of social media, false content and disinformation spread faster than authentic information (Daud et al. 2020). In Malaysia, the spread of fake news via social networking sites has increased significantly during the pandemic (Raj 2020).
Findings from past studies show that people use specific social media sites such as WeChat, Facebook, and WhatsApp to share diverse news content (Kümpel, Karnowski and Keyling 2015; Peng and Miller 2021: 1). Previous research focuses on the motivation to adopt social media to practice citizen journalism; for example, people practice citizen journalism to shape public opinion (Jalli 2017), to spread fake news during the COVID-19 pandemic (Raza et. 2021: 145), and to promote cultural integration (Mahamed and Omar 2017: 675).
The present study aims to identify the factors that influence citizens’ adoption of social media platforms for citizen journalism. It is designed to establish the connection between social media engagement and citizen journalism practice. The unified theory of acceptance and use of technology (UTAUT) was applied to identify the factors affecting social media engagement in citizen journalism. The current study proposes a model that aims to contribute a theoretical perspective on social media engagement to the practice of citizen journalism.
Literature Review
Social Media Engagement
Social media are widespread platforms for publishing news and entertainment content. One study found that 35% of people aged 18-29 use online sources as their primary news source (Shearer 2018). According to Albaalharith et al. (2021), half of the world’s 7.7 billion people use various social media platforms. Social media refers to internet-based communication networking platforms that facilitate communication through computer and mobile applications (Aichner et al. 2021). It is estimated that about 4.0 billion people use social media, with Facebook ranked first, followed by YouTube, WeChat, and LinkedIn (Kobiruzzaman 2021). According to Kobiruzzaman (2021), approximately 2.74 billion users access Facebook worldwide each month.
Kalsnes and Larsson (2018) stated that Facebook is the most effective site for news sharing, following Twitter. It allows users to become opinion leaders and gatekeepers. A study shows that social media encourages users to act as news sources (Oeldorf-Hirsch and Sundar 2015). People use social networking sites to share, like, and comment on news content for convenience. Nowadays, users use social networking platforms to share real-time news about events to enhance engagement (Kobiruzzaman et al. 2018).
Anyone can share a live news event on Facebook using the live video feature. Alexander (2014) reported that 80% of Americans and 70% of social media users acknowledge that social networking sites are valuable tools for disseminating news during disaster management crises. According to a study, around 26.69 million people use internet services in Malaysia, accounting for almost 85% of the total population (Kamaruddin and Rogers 2020). The role of citizen journalists has increased with the rise of smartphones (Allan 2017).
Malaysians use social media to consume news and information for immediate, convenient access (Mahamed et al. 2020). Another study shows that social media have become indispensable for sharing and consuming news (Kümpel et al. 2015). These social networking sites have ease-of-use features for sharing content. Individuals and media organizations use convenient features to post news content.
Citizen Journalism Practice (CJP)
Citizen journalists use social media websites and mobile applications to disseminate news quickly. It is the process of gathering and reporting hard and soft news. Citizen journalists also collect and analyze news, then report it on digital platforms to inform others (Allan 2017; Lacy, Duffy, Riffe, Thorson, and Fleming 2010). People prefer social media over websites for digital journalism because of its convenient content-sharing features. It offers a stress-free way to interact and an opportunity for citizens to share news content. Citizen journalists help fill the gap left by the mass media industry.
Malaysian political parties firmly control the mainstream media; therefore, journalists cannot play their role independently (Balaraman et al. 2015). Hence, many people are prone to using social media to report crime and real-time news. Citizen journalism in Malaysia has become a vital tool for political parties to spread promotional news events on social media to attract supporters and potential voters (Chinnasamy and Roslan 2015). In 2013, the 13th General Election in Malaysia highlighted the importance of online media for disseminating reliable information, whereas mainstream media are biased in their coverage of political news (Kee and Nie 2017).
Citizen journalism activities promote cultural integration among Malaysians from various cultural backgrounds (Mahamed & Omar, 2017). It promotes harmony and peace in Malaysia through sharing information via social media platforms. Many students become citizen journalists to share information about people affected by COVID-19 and the coronavirus death toll on social media. The convenient tools of social media influence students to become digital journalists. Besides the advantages, social media-based citizen journalism significantly spreads fake and fabricated news. Widespread misinformation was disseminated through Facebook and Twitter during the 2016 US election.
The expansion of technology and social media has changed people’s news consumption behavior. It is crucial to study people’s needs to comprehend their behaviors. Social and psychological needs influence how people behave in relation to social media use. People can use social media to report news for various purposes. News content can be short or long, depending on the topic. Citizens modify traditional media content and share it again to spread the news in their community. Sometimes, traditional media create news based on citizen journalist reports. In this study, we considered all types of news produced by citizens and shared on social media to meet personal, social, political, organizational, and informational goals.
We diagnosed social media-based citizen journalism from a uses-and-gratifications perspective. Michailina, Andreas, and Christos (2015) identified that people utilize social networking sites for four needs: information, discussion, entertainment, and surveillance.
Based on the literature review, the UTAUT model has been shown to be a valid and robust framework for understanding the factors influencing people to use social media platforms for citizen journalism. Hence, the relationship between social media engagement and citizen journalism practice can be examined using the UTAUT model.
Unified Theory of Acceptance and Use of Technology (UTAUT Model)
Social media and communication technologies are closely intertwined in their practical functions in society (Ou, Sia, and Hui 2013). People adopt social media to meet individual, social, political, and commercial needs. Previous research validates the unified theory of technology acceptance and use as a comprehensive theoretical model for predicting adoption intention for social media platforms. Peng and Miller (2021) argue that UTAUT is an effective model for explaining people’s news use behavior on WeChat, a popular social media platform in China.
Consequently, the UTAUT model certainly provides an in-depth understanding of factors that predict citizen journalism practice on social media. Venkatesh, Davis, Morris, and Fred D. Davis developed the UTAUT model in 2003, based on eight well-known technology adoption models (Venkatesh et al. 2003). Based on the user acceptance literature, technology adoption models are widely used to identify factors influencing users’ adoption of new information and communication technologies (Rauniar, Rawski, Yang, and Johnson 2014). Venkatesh et al. (2003) identified four constructs that directly and indirectly determine users’ motivation to use the system. The three constructs (1. Performance Expectancy, 2. Effort Expectancy, and 3. Social Influence) determine the intention to use the technology through behavioral intention.
The fourth characteristic (Facilitating Conditions) directly determines the intention to use the technology. The UTAUT model also presents four moderator variables (Age, Gender, Experience, and voluntariness of use). The current study investigated users’ intentions to use social media for citizen journalism, based on their perceptions of the practice. Hence, we applied the UTAUT model to explain why and how users adopt social media platforms for citizen journalism. Venkatesh et al. (2003) identified performance expectancy, effort expectancy, facilitating conditions, and social influence as the four determinants of technology usage intention. Social media sites have become very popular for practicing citizen journalism, particularly with respect to the performance expectancy, effort expectancy, and social influence determinants. The UTAUT model is applicable for identifying the determinants and consequences of using social media sites for citizen journalism.
Hypothesis Development
Performance Expectancy (PE)
Performance expectancy concerns how the new system will help users improve performance in completing the task (Venkatesh et al. 2003). It validates why the new system is advantageous for individual performance and improves efficacy. It also simulates the decision-making process behind their use of the system. In a social context, people accept new technology when they see benefits. Performance expectancy reflects the perceived importance of new media and technology, influencing a person to adopt the latest technology (Mortenson and Vidgen 2016). Social media is definitely an advantageous technology in practicing citizen journalism.
Peng and Miller (2021) stated that people use the WeChat application for social media news because they perceive it as an advantageous tool. Based on this statement, this research hypothesized that when people view social media platforms as helpful tools, they will use them to engage in citizen journalism.
H1: Performance expectancy will positively influence social media users to practice citizen journalism.
Effort Expectancy (EE)
Effort expectancy refers to how easy and effortless it will be to complete the test (Venkatesh et al., 2003). Researchers employ this construct to examine ease of use. It represents the extent to which users perceive modern technology as simple to learn and operate (Ismail et al. 2021). Effort expectancy demonstrates the ease and effortlessness of using the new technology. People will adopt new technology if the tools are easy to use, which affects their decision to adopt particular technology.
However, users might not adopt the new system if it is challenging to operate and takes much longer than the previous technique. Effort expectancy is a crucial factor in making an adoption decision at the beginning stage. According to Lane and Coleman (2012), people prefer to use social networking platforms for social and business purposes because they are easy to use. Based on the above discussion, we hypothesized that if people perceive social media as trouble-free, effortless tools for sharing news events, they will adopt them to engage in citizen journalism.
H2: Effort expectancy will positively influence social media users to practice citizen journalism.
Social Influence (SI)
Social influence is the degree to which users prioritize other beliefs, which is why they should utilize the new system (Venkatesh et al. 2003). It directly affects others’ behavioral intentions to adopt the technology. People change their technology use behaviors when they consider that others benefit from the new technology (Peng & Miller, 2021; Mortenson & Vidgen, 2016). Social influence can come from friends, colleagues, family members, relatives, and managers. It happens at the initial stage when people are expected to meet their own and others’ expectations.
Peng and Miller (2021) indicated that people adopt WeChat for social media news use because it is recommended and suggested by peers. Therefore, this study hypothesized that people adopt social media to engage in citizen journalism when they observe others using these sites for the same purposes.
H3: Social influence will influence social media users to practice citizen journalism positively.
Conceptual Model
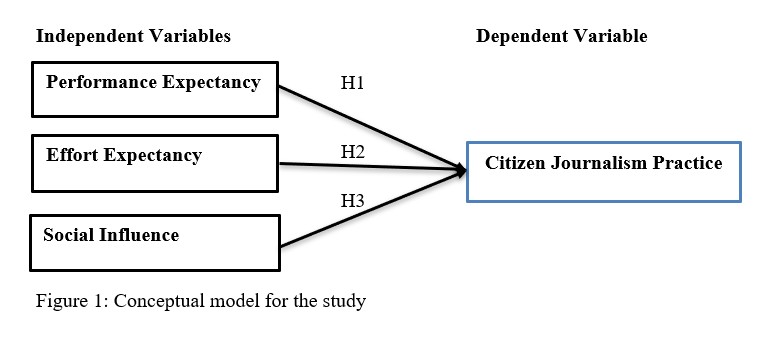
The researchers presented a conceptual model for this study based on a literature review and adapted from the UTAUT model. The model shows an explicit relationship between the independent variables (Performance expectancy, Effort expectancy, and Facilitating conditions) and the dependent variable (Citizen Journalism Practice). Mainly, it presents a direct relationship between the performance expectancy of social media engagement and the practice of citizen journalism.
Additionally, there is a connection between the effort expectancy of social media engagement and citizen journalism practice. The model also shows a clear connection between the facilitating conditions for social media engagement and citizen journalism practice. Furthermore, this conceptual framework examines the influence of the three independent variables on the dependent variables.
Methodology
Sampling and Data Collection
The theoretical goal of this research is to investigate factors affecting social media engagement in citizen journalism using the UTAUT model. A quantitative research approach was administered to gather and analyze numerical data. Additionally, a convenience sampling strategy was employed to collect data via online survey questionnaires on Google Forms. The researchers developed a self-administered questionnaire and uploaded it to Google Forms. Afterward, the Google Form link was shared among university students through email and WhatsApp.
The online questionnaire link was sent to the students who use social networking sites to exercise citizen journalism. The researchers adopted the Structural equation model (SEM-PLS) to investigate causal connections between independent and dependent variables and validate the proposed conceptual model. Kline (2015) suggested that at least 150 respondents were needed for a satisfactory analysis using a structural equation modeling (SEM) tool. Since this research included 17 observable variables, the minimum sample size was 17×10=170, as most scholars recommended a sample size of 10 cases per parameter.
However, the researchers suggested 301 samples for this study to analyze the conceptual model. The data were collected from 301 university students in Malaysia from different levels of study, including bachelor’s, master’s, and PhD programs. The research topic is related to new technology and social media; therefore, it was perceived that university students have enough knowledge and experience in using social media to practice citizen journalism.
Questionnaire Development
The authors used research instruments to collect data on university students’ perceptions of social media engagement in the practice of citizen journalism. The online survey questionnaire is a quick, cost-effective, and efficient way to gather information from many people. The research model contained three independent variables and one dependent variable estimated by 17 items adapted from previous studies (Venkatesh et al. 2003; Peng and Miller 2021; and Puriwat and Tripopsakul 2021).
Researchers modified the items to fit the context of social media use for citizen journalism. In this study, the researchers employed a 5-point Likert scale to measure 17 items across three independent variables (PE, EE, SI) and one dependent variable (CJP). The 5-point Likert scale was used, ranging from 1=strongly disagree, 2=disagree, 3=somewhat agree, 4=agree, and 5=strongly agree. In the conceptual framework, the independent variables include three constructs: performance expectancy (4 items), effort expectancy (4 items), and social influence (5 items).
The dependent variable includes the construct of citizen journalism practice (4 items). To measure the independent variable’s performance expectancy, item PE1 was adapted from Venkatesh et al. (2003), items PE2 and PE3 were adapted from Peng and Miller (2021), and Item PE4 was adapted from Puriwat and Tripopsakul (2021). Additionally, Item EE1 was adapted from Venkatesh et al. (2003), Item EE2 from Peng and Miller (2021), and Items EE3 and EE4 from Puriwat and Tripopsakul (2021) to measure the independent variable, effort-expectancy.
Moreover, items SI1 and SI2 were adapted from Venkatesh et al. (2003), item SI3 was adapted from Peng and Miller (2021), and items SI4 and SI5 were adapted from Puriwat and Tripopsakul (2021) to measure the independent variable social influence. Finally, items CJP1 and CJP2 were adapted from Peng and Miller (2021), and items CJP2 and CJP3 were adapted from Puriwat and Tripopsakul (2021) to measure the dependent variable of citizen journalism practice. The 17 observed variables across four constructs are presented in Table 1.
Table 1. The details of constructs and observable variables in the study.
Constructs
Items
Observed Variables
Source
Performance Expectancy (PE)
PE1.
I find social media useful in practicing citizen journalism
Venkatesh et al. (2003)
PE2
Using social media increases my productivity in reporting real-time news events to my friends and co-workers.
Peng and Miller (2021)
PE3
Social media informs me what news is necessary for my friends and co-workers.
PE4
Social media allows me to spend less time reporting and consuming news.
Puriwat and Tripopsakul (2021).
Effort Expectancy (EE)
EE1
My citizen journalism through social media would be straightforward and understandable.
Venkatesh et al. (2003)
EE2
I would find social media-based citizen journalism easy to use
Peng and Miller (2021)
EE3
Learning to operate social media to practice citizen journalism is easy for me.
Puriwat and Tripopsakul (2021).
EE4
Social media are suitable platforms to post and share news events
Social Influence (SI)
SI1
People close to me believe I should use social media to share news.
Venkatesh et al. (2003)
SI2
The senior students at my university recommend that I use social media to find academic news.
SI3
I noticed my friends sharing news on social media and discussing what they read there.
Peng and Miller (2021)
SI4
I feel proud when my friends praise me for sharing informative news on social media.
Puriwat and Tripopsakul (2021).
SI5
I become motivated when my social media friends benefit from my reporting.
Citizen Journalism Practice
CJP1
I often use social media for writing and sharing news content
Peng and Miller (2021)
CJP2
I have been using social media regularly to report real-time news with friends.
CJP3
I take advantage of online social networking sites to perceive hard news
Puriwat and Tripopsakul (2021).
CJP4
I use social media platforms to read informative news easily.
Results and Discussions
Demographic Details of Respondents
Most respondents were female (55.8%, 168 out of 301 students), and 44.2% were male (133 out of 301 students). Additionally, most respondents were in the 18-23 age group, which is the youth. The majority of respondents in this study are undergraduate students (76.1%), followed by foundation (8.0%), STPM (7.0%), Diploma (4.0%), Matric (3.0%), and Master’s and PhD (1.0%). Moreover, for the year of study, most students were in their second year (33.9%, 102 students), and the respondents’ highest percentage of family monthly income was RM2001–4000 (38.9%, 117 respondents). The demographic statistics reports are detailed in Table 2.
Table 2: Respondents’ Demographic Details
Demographic Items (n=301)
Description
Frequency
Percent
Gender
Male
Female
133
168
44.2
55.8
Age
18-23
24-28
29-33
Above 33
181
105
14
1
60.1
34.9
4.7
.3
Nationality
Malaysian
Non-Malaysian
215
86
71.4
28.6
Race
Malay
Chinese
Indian
Bangladeshi
Mauritian
Indonesian
Arab
African
Kadazan
Siamese
118
97
52
14
2
6
7
1
2
2
39.2
32.2
17.3
4.7
0.7
2.0
2.3
0.3
0.7
0.7
Education
Undergraduate
Foundation
STPM
Diploma
PhD
Matric
Masters
229
24
21
12
3
9
3
76.1
8.0
7.0
4.0
1.0
3.0
1.0
Year of Study
Year 1
Year 2
Year 3
Year 4
Above 4
98
102
81
17
3
32.6
33.9
26.9
5.6
1.0
Family Monthly Income
RM2000 and below
RM2001 – RM4000
RM4001 to RM6000
Over RM6000
75
117
66
43
24.9
38.9
21.9
14.3
Construct Reliability and Validity Analysis
PLS-SEM (SmartPLS 4) was employed to estimate the instrument’s construct reliability and validity. The Average Variance Extracted (AVE) was computed to assess the convergent validity of the constructs. Table 3 shows that the item loading score surpasses 0.5, composite reliability (CR) exceeds 0.7, and Cronbach’s Alpha (CA) score surpasses 0.7. These scores provide sufficient evidence of the reliability and validity of the constructs. The reliability and validity outcomes in Table 3 validated the consistency and accuracy of the independent variables —three constructs: performance expectancy, effort expectancy, and social influence—and the dependent variable, the conceptual model’s citizen journalism practice.
Table 3. Reliability and Validity of Constructs.
Construct
Item Code
Item Loadings
Composite Reliability (CR)
Average Variance Extracted (AVE)
Cronbach’s Alpha (CA)
Performance Expectancy (PE)
PE1
0.781
0.846
0.677
0.841
PE2
0.844
PE3
0.844
PE4
0.820
Effort Expectancy (EE)
EE1
0.883
0.882
0.738
0.881
EE2
0.887
EE3
0.828
EE4
0.836
Social Influence (SI)
SI1
0.823
0.880
0.663
0.873
SI2
0.741
SI3
0.813
SI4
0.835
SI5
0.854
Citizen Journalism Practice (CJP)
CJP1
0.828
0.766
0.573
0.743
CJP2
0.564
CJP3
0.820
CJP4
0.784
CJP1
0.828
Table 3 represents the reliability and validity of the four constructs. Composite reliability (CR), Cronbach’s Alpha (CA), and Average Variance Extracted (AVE) were employed to estimate the reliability and validity of the conceptual model’s constructs. Tavakol and Dennick (2011) mentioned that CR and CA values are acceptable when they exceed 0.7. The researchers found that all the CR and CA item values were above 0.7, as shown in Table 3.
Fornell and Larcker (1981) stated that AVE values are acceptable when they exceed 0.5, and the results of this study showed that AVE scores for all constructs exceeded 0.6. Hence, the authors accepted items whose outer loading values were within the acceptable range. The data analysis identified 17 items: PE (4), EE (4), SI (5), and CJP (4). The researchers deleted three items because their standardized factor loadings were less than 0.5.
Discriminant Validity
The Discriminant Validity of all the variables has been examined through the Fornell-Larcker criterion and the Heterotrait-monotrait ratio (HTMT), which are presented in Tables 4 and 5.
Table 4: Fornell-Larcker Criterion
CJP
EE
PE
SI
CJP
0.757
EE
0.784
0.859
PE
0.634
0.568
0.823
SI
0.801
0.720
0.533
0.814
In general, the Fornell-Larcker criteria are used to measure the extent to which latent variables in a model share variance (Fornell & Larcker, 1981). The Fornell-Larcker criteria indicate that the square roots of the AVEs for all variables are greater than their respective intercorrelations (Henseler et al., 2015: 122). Consequently, the validity and reliability assessments indicate that the measurement model is acceptable, and the results confirm this conclusion.
Table 5: Heterotrait-Monotrait Ratio (HTMT)
Construct
CJP
EE
PE
EE
0.967
PE
0.829
0.656
SI
0.969
0.823
0.616
HTMT is an alternative method for assessing the discriminant validity of the constructs. Henseler et al. (2015) stated that an HTMT value below 1 is acceptable. In the current study, the minimum and maximum HTMT values are 0.616 and 0.969, confirming the validity of the constructs in this research model.
Assessment of the Structural Model
Table 6: Coefficient of Determination (R2)
Construct
R-square
R-square adjusted
CJP
0.756
0.753
Table 6 presents the Coefficient of Determination (R2), which indicates the model’s good fit. The adjusted R2 value was 0.756 (76%), which is above 25%. Cohen (2013) stated that an R2 value greater than 0.26 indicates that the model is significant. In this study, the R2 (0.756) and the adjusted R-square (0.753) were substantially acceptable levels of prediction for empirical research.
Table 7: Effect size (f2)
Construct
CJP
Effect Size
EE
0.224
Medium
PE
0.104
Small
SI
0.363
Large
The value of effect size (f2) was presented in Table 7. According to Cohen (2013), an f2 value above 0.34 represents a large effect size, an f2 value above 0.14 and below 0.34 represents a medium effect size, and an f2 value above 0.01 and below 0.14 represents a small effect size. In this study, the effect sizes EE, PE, and SI had medium, small, and large effects on CJP, respectively.
Table 8: Multicollinearity Statistics (Inner VIF)
Construct
CJP
EE
2.305
PE
1.549
SI
2.180
The Inner VIF values for the multicollinearity test are presented in Table 8. According to Pallant and Manual (2020), a VIF value above 10 and below 0.1 indicates the presence of multicollinearity. The minimum and maximum values of multicollinearity were found to be 1.549 and 2.305, respectively, indicating the presence of multicollinearity among the independent variables.
Table 9: Predictive Relevance (Q2)
Construct
Q²predict
CJP
0.745
The Q2 value is presented in Table 9 and indicates whether a model is predictive. In the current study, the Q2 value is found to be 0.745, which is higher than zero (0), and a Q2 value greater than zero indicates the presence of predictive relevance (Chin 1998).
Table 10: Hypothesis Test
Relationship
Original Sample (O)
Sample Mean (M)
Standard Deviation (STDEV)
T statistics
P values
EE -> CJP
0.355
0.351
0.055
6.501
0.000
PE -> CJP
0.198
0.199
0.048
4.122
0.000
SI -> CJP
0.440
0.443
0.053
8.372
0.000
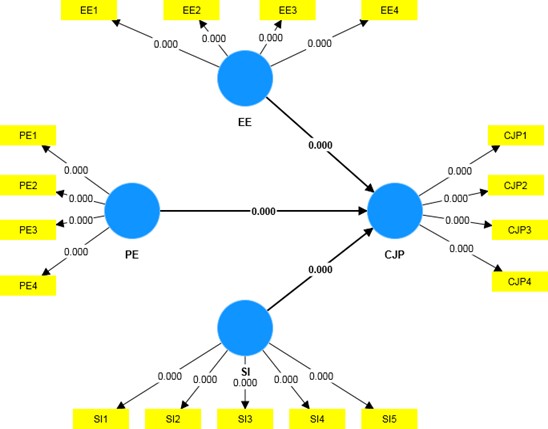
Figure 2: Path Analysis Result
Results
The PLS-SEM analysis indicated that the proposed model fit adequately, as evidenced by the standardized beta values, T values, and p-values reported in Table 10. The proposed model, adopted from the UTAUT, explained the relationship between social media engagement and citizen journalism (R2=0.75,6 see Table 6). Table 10 and Figure 2 illustrate the results of the hypothesis test. Hypotheses are accepted when the T statistics exceed 1.96 and all p-values are less than 0.05 (Greenland et al. 2016). The standardized beta values indicate that, among all the hypotheses, PE, EE, SI, and CJP have the strongest relationships.
H1 hypothesized that performance expectancy would positively influence social media users to practice citizen journalism. The PLS-SEM data analysis confirmed the relationship between performance expectancy and social media engagement in practicing citizen journalism (T = 4.122, p < 0.001). Hence, H1 is accepted as significant, with a T value of 4.122 and a p-value of 0.000 (see Table 10). The results show that the intention to engage in citizen journalism increased with social media engagement, as it enhances users’ performance.
H2 posited that effort expectancy will positively influence social media users to practice citizen journalism. According to PLS-SEM analysis, effort expectancy was positively associated with social media usage in citizen journalism (T = 6.501, p < 0.001). More specifically, H2 was accepted as the T value was 8.372 and the p-value was 0.000 (see Table 10). Citizens use social media to practice citizen journalism because of its easy-to-use features.
H3 proposed that social influence would encourage social media users to engage in positive citizen journalism. Social influence was also positively related to social media use for citizen journalism (T = 8.372, p < .001). Moreover, H3 was accepted as the T value was 8.372 and the p-value was 0.000 (see Table 10). People share and consume news events on social media when others suggest following them.
The current study developed three hypotheses, all of which were accepted based on their statistical significance. The results illustrated that performance expectancy, effort expectanc,y and social influence were significant motivators in social media usage to practice citizen journalism. Nowadays, people prefer to utilize social media platforms to generate and share news rather than blogs. Hence, the conceptual model of this study can serve as a basis for future research in other contexts.
Discussion
This study examined factors influencing social media adoption in citizen journalism. The results show that social media engagement is related to citizen journalism. The findings confirm that this study is consistent with previous research. Venkatesh et al. (2003) mentioned that performance expectancy (PE), effort expectancy (EE), and social influence (SI) directly and positively influence usage behavior (UB) in the UTAUT model. Peng and Miller (2021) suggested that effort expectancy, task-technology fit, facilitating conditions, and social influence are potent motivators of social media news use behavior.
The empirical data from this study showed that performance and effort expectancies, as well as social influence, positively affect social media adoption for practicing citizen journalism (CJ). Overall, the findings strongly supported all three hypotheses (H1, H2, &H3). The PLS-SEM analysis demonstrates that the unified theory of acceptance and use of technology (UTAUT) helps examine the correlation between social media engagement and citizen journalism. The authors proposed a new model to explain how social media users influence citizen journalism. The findings show that respondents practice citizen journalism on social media to report real-time news, inform and entertain friends, raise social awareness, shape public opinion, and search for academic news across multiple accounts.
Hypothesis 1 predicts that performance expectancy (T = 4.122, p = 0.000) affects social media users’ intention to practice citizen journalism. According to the results, students who use social media perceived it as easy to use to report news content. The findings also show that Facebook is the most useful platform to share news content, followed by Twitter, LinkedIn, Instagram, WhatsApp, and WeChat. Social media allows people to report crimes and share real-time news with friends and co-workers. The results showed that citizen journalists were satisfied with the performance expectations of social media engagement for practicing citizen journalism.
According to hypothesis 2, effort expectancy (T = 6.501, p = 0.000) was a powerful predictor of social media users’ willingness to practice citizen journalism. Previous studies supported the findings; for example, Peng and Miller (2021) proposed that WeChat’s convenient features influence individuals’ news sharing on it. The news on social media is straightforward and understandable. Findings also showed that citizen journalists were satisfied with the expected effects of their social media involvement, as they experienced them practically. The finding from hypothesis 3 (T=8.372, p=0.000) indicated that social influence mainly affects social media users’ participation in citizen journalism.
People practice citizen journalism on social networking sites such as Facebook, WeChat, WhatsApp, and Twitter, motivated by friends. Individuals adopt WeChat to consume news motivated by close friends who use and recommend it to others (Peng & Miller, 2021). Social influence theory holds that social media users engage in citizen journalism because they prefer to maintain relationships with others who respect them (Venkatesh and Davis 2000; Chen 2020). People become motivated when they see their friends benefit from reporting on social media. According to the findings, suggestions from a favorite person influence people to adopt news-consumption behavior, and this result was consistent with previous research.
Conclusion
This study investigates the relationship between social media engagement and citizen journalism practice using the Unified Theory of Acceptance and Use of Technology (UTAUT). The study validated the hypotheses that Effort Expectancy, Performance Expectancy, and Social Influence positively influence citizens’ use of social media to practice citizen journalism. The results showed that citizen journalists were satisfied with the effort expectancy, performance expectancy, and social influence of social media engagement in practicing citizen journalism.
This research contributed to the theoretical understanding of the UTAUT model, as only a few studies have examined social media-based citizen journalism practice. Thus, the current research contributes to filling the literature gap by validating all three hypotheses that performance expectancy (PE), effort expectancy (EE), and social influence (SI) affect social media users’ behaviors. The expansion of social networking platforms has led to an increase in digital journalism worldwide. Our study certainly offers managerial significance to practitioners and policymakers. Government authorities and policymakers can train digital journalists on social media platforms. Educational institutions can use social media for learning, as the findings showed that students spend a significant amount of time on it.
Although this research offered theoretical and practical implications for society, it still has some limitations. The empirical data were gathered from university students in Malaysia; hence, the outcome of this study is generalized based on Malaysian culture. Future studies can examine social media engagement in other cultures and countries to practice online journalism. Additionally, future research can investigate the technological factors that contribute to engaging citizens in digital journalism. A qualitative research method can also be adapted to examine social media engagement in citizen journalism. The rigorous interview tool in qualitative research can provide in-depth insights and findings into social media-based journalism. Other research may also investigate the relationship between smartphone use and online journalism through content analysis.
Contributor Details
M M Kobiruzzaman currently studies at the Department of Communication, Universiti Putra Malaysia. His research jurisdiction also includes Journalism, Social Media Communication, and Corporate Communication. He has published some creative and academic articles. He is ready to impart his knowledge to other people.
Mastura Mahamed currently works at the Department of Communication, Universiti Putra Malaysia. She conducts research in Communication and Media, particularly in journalism and youth and media. She was also involved in the study of Social Policy and Qualitative Social Research.
Aichner, T., Grünfelder, M., Maurer, O. and Jegeni, D., 2021. Twenty-five years of social media: a review of social media applications and definitions from 1994 to 2019. Cyberpsychology, behavior, and social networking, 24(4), pp.215-222.
Alexander, D.E., 2014. Social media in disaster risk reduction and crisis management. Science and engineering ethics, 20(3), pp.717-733.
Allan, S. ed., 2017. Photojournalism and citizen journalism: co-operation, collaboration and connectivity. Taylor & Francis.
Balaraman, R.A., Hashim, N.H., Hasno, H., Ibrahim, F. and Arokiasmy, L., 2015. New media: online citizen journalism and political issues in Malaysia. Pertanika Journals Social Science & Humanities, 23, pp.143-154.
Barry, J., 2017. Democracy’s Double-Edged Sword: How Internet Use Changes Citizens’ Views of Their Government, by Catie Snow Bailard. Baltimore, MD: Johns Hopkins University Press, 2014. 162 pp. $34.95 paperback.
Chen, V.Y., 2021. Examining news engagement on Facebook: Effects of news content and social networks on news engagement. In Social Media News and Its Impact (pp. 26-50). Routledge.
Chin, W.W., 1998. The partial least squares approach to structural equation modeling. Modern methods for business research, 295(2), pp.295-336.
Chinnasamy, S. and Roslan, I., 2015. Social Media and Online Political Campaigning in Malaysia. Advances in Journalism and Communication, 3(04), p.123.
Cohen, J., 2013. Statistical power analysis for the behavioral sciences. Hoboken. NJ: Taylor and Francis.
Daud, Mahyuddin, and Sonny Zulhuda. “Regulating The Spread of False Content Online in Malaysia: Issues, Challenges and The Way Forward.” International Journal of Business & Society 21 (2020).
Fornell, C. and Larcker, D.F., 1981. Evaluating structural equation models with unobservable variables and measurement error. Journal of Marketing Research, 18(1), pp.39-50.
Greenland, S., Senn, S.J., Rothman, K.J., Carlin, J.B., Poole, C., Goodman, S.N. and Altman, D.G., 2016. Statistical tests, P values, confidence intervals, and power: a guide to misinterpretations. European Journal of Epidemiology, 31(4), pp. 337-350.
Henseler, J., Ringle, C.M. and Sarstedt, M., 2015. A new criterion for assessing discriminant validity in variance-based structural equation modeling. Journal of the Academy of Marketing Science, 43(1), pp.115-135.
Ismail, N., Ahmad, J., Noor, S.M. and Saw, J., 2019. Malaysian Youth, Social Media Following, and Natural Disasters: What Matters Most to Them?. Media Watch, 10(3), pp.508-521.
Jalli, N.B., 2017. Media and Politics: Students’ Attitudes and Experts’ Opinions Towards Citizen Journalism and Political Outcomes in Malaysia. Ohio University.
Jalli, N., 2020. Exploring the influence of citizen journalism content on the Malaysian political landscape. Kajian Malaysia: Journal of Malaysian Studies, 38(1).
Kalsnes, B. and Larsson, A.O., 2018. Understanding news sharing across social media: Detailing distribution on Facebook and Twitter. Journalism studies, 19(11), pp.1669-1688.
Kamaruddin, N. and Rogers, R.A., 2020. Malaysia’s democratic and political transformation. Asian Affairs: An American Review, 47(2), pp.126-148.
Kobiruzzaman, M.M., Waheed, M., Yaakup, H.S.B. and Osman, M.N., 2018. Impact of Social Media on Society: A Case Study on Teenagers. International Journal of Education and Knowledge Management, 1(3), pp.1-12.
Kobiruzzaman, M.M., 2021. Role of Social Media in Disaster Management in Bangladesh Towards the COVID-19 Pandemic: A Critical Review and Directions. International Journal of Education and Knowledge Management (IJEKM), 4(2), pp.1-14.
Kümpel, A.S., Karnowski, V. and Keyling, T., 2015. News sharing in social media: A review of current research on news sharing users, content, and networks. Social media+ society, 1(2), p.2056305115610141.
Lacy, S., Duffy, M., Riffe, D., Thorson, E., and Fleming, K., 2010. Citizen journalism websites complement newspapers. Newspaper Research Journal, 31(2), pp.34-46.
Lane, M. and Coleman, P., 2012. Technology’s ease of use through social networking media. Journal of Technology Research, 3, p.1.
Mahamed, M. and Omar, S.Z., 2017. Citizen Journalism Role in Promoting Cultural Integration and Peace in Malaysia. International Journal of Academic Research in Business and Social Sciences, 7(8), pp.673-680.
Mortenson, M.J. and Vidgen, R., 2016. A computational literature review of the technology acceptance model. International Journal of Information Management, 36(6), pp.1248-1259.
Michailina, S., Andreas, M., and Christos, P., 2015. Understanding online news: uses and gratifications of mainstream news sites and social media. International Journal of Strategic Innovative Marketing, 3(1), pp.1-13.
Oeldorf-Hirsch, A. and Sundar, S.S., 2015. Posting, commenting, and tagging: Effects of sharing news stories on Facebook. Computers in human behavior, 44, pp.240-249.
Ou, C.X., Sia, C.L. and Hui, C.K., 2013. Computer‐mediated communication and social networking tools at work. Information Technology & People.
Pallant, J. and Manual, S.S., 2013. A step-by-step guide to data analysis using IBM SPSS. Australia: Allen & Unwin. Doi, 10(1), pp.1753-6405.
Peng, Z. and Miller, S., 2021. An Examination of How Social and Technological Perceptions Predict Social Media News Use on WeChat. Journalism Practice, pp.1-20.
Rauniar, R., Rawski, G., Yang, J. and Johnson, B., 2014. Technology acceptance model (TAM) and social media usage: an empirical study on Facebook. Journal of Enterprise Information Management.
M M Kobiruzzaman is a researcher, academic content writer, traveler, and the founding editor of Newsmoor.com. Specializing in communication, management, technology adoption models, and frameworks analysis, and journalism, his work bridges the gap between theory explanation and cultural communication. With a strong background in communication and management, he is dedicated to providing authoritative guides that elevate business and media literacy and academic writing standards.